

Appearance
How is pulse segmentation performed?
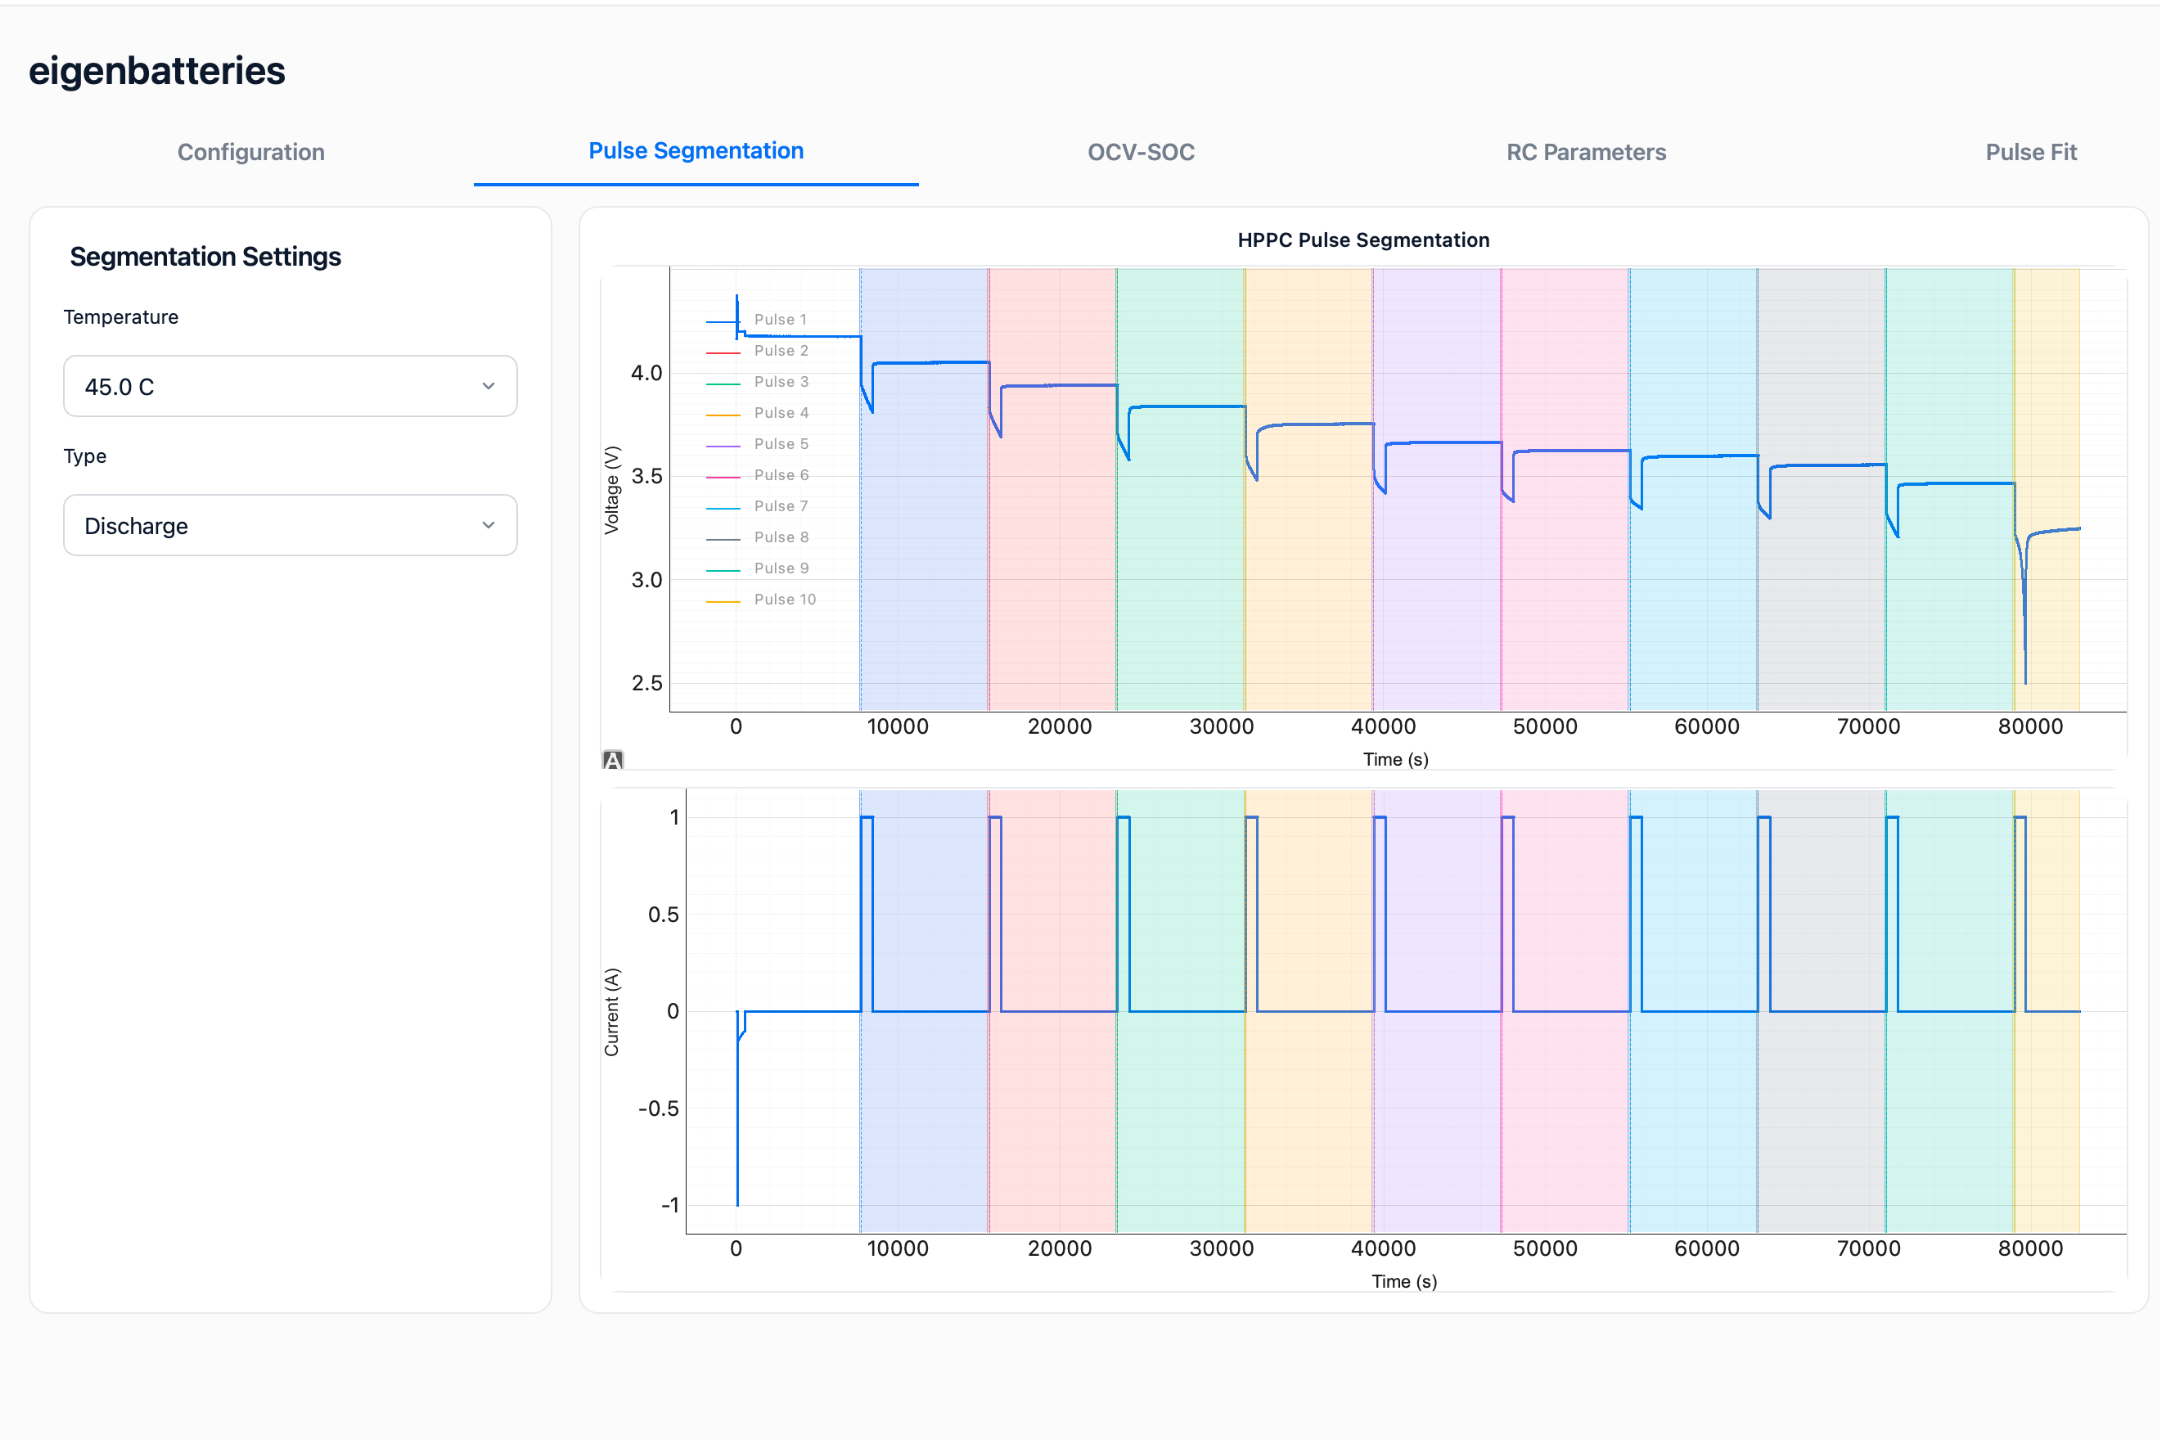
The Pulse Segmentation tab displays the HPPC pulse detection results generated from the uploaded characterization dataset. The software automatically identifies individual pulse events based on the configured pulse threshold and groups them for subsequent ECM parameter extraction.
Purpose
The Pulse Segmentation tab allows users to:
- Verify automatic pulse detection.
- Review pulse locations within the HPPC dataset.
- Confirm the number of pulses identified for analysis.
- Validate that the characterization data is suitable for parameter extraction.
Segmentation Settings
The left panel contains controls used to view segmentation results.
| Field | Description |
|---|---|
| Temperature | Select characterization temperature |
| Type | Select Charge or Discharge dataset |
Changing these settings updates the displayed segmentation results.
HPPC Pulse Segmentation Plot
The central display contains two synchronized graphs:
Voltage Profile
The upper graph shows battery voltage throughout the HPPC test. Colored markers indicate the pulse regions automatically detected by the software.
Current Profile
The lower graph shows the applied current profile. Pulse locations are highlighted and aligned with the corresponding voltage response.
The displayed pulse regions represent the data used during RC parameter identification and pulse fitting.
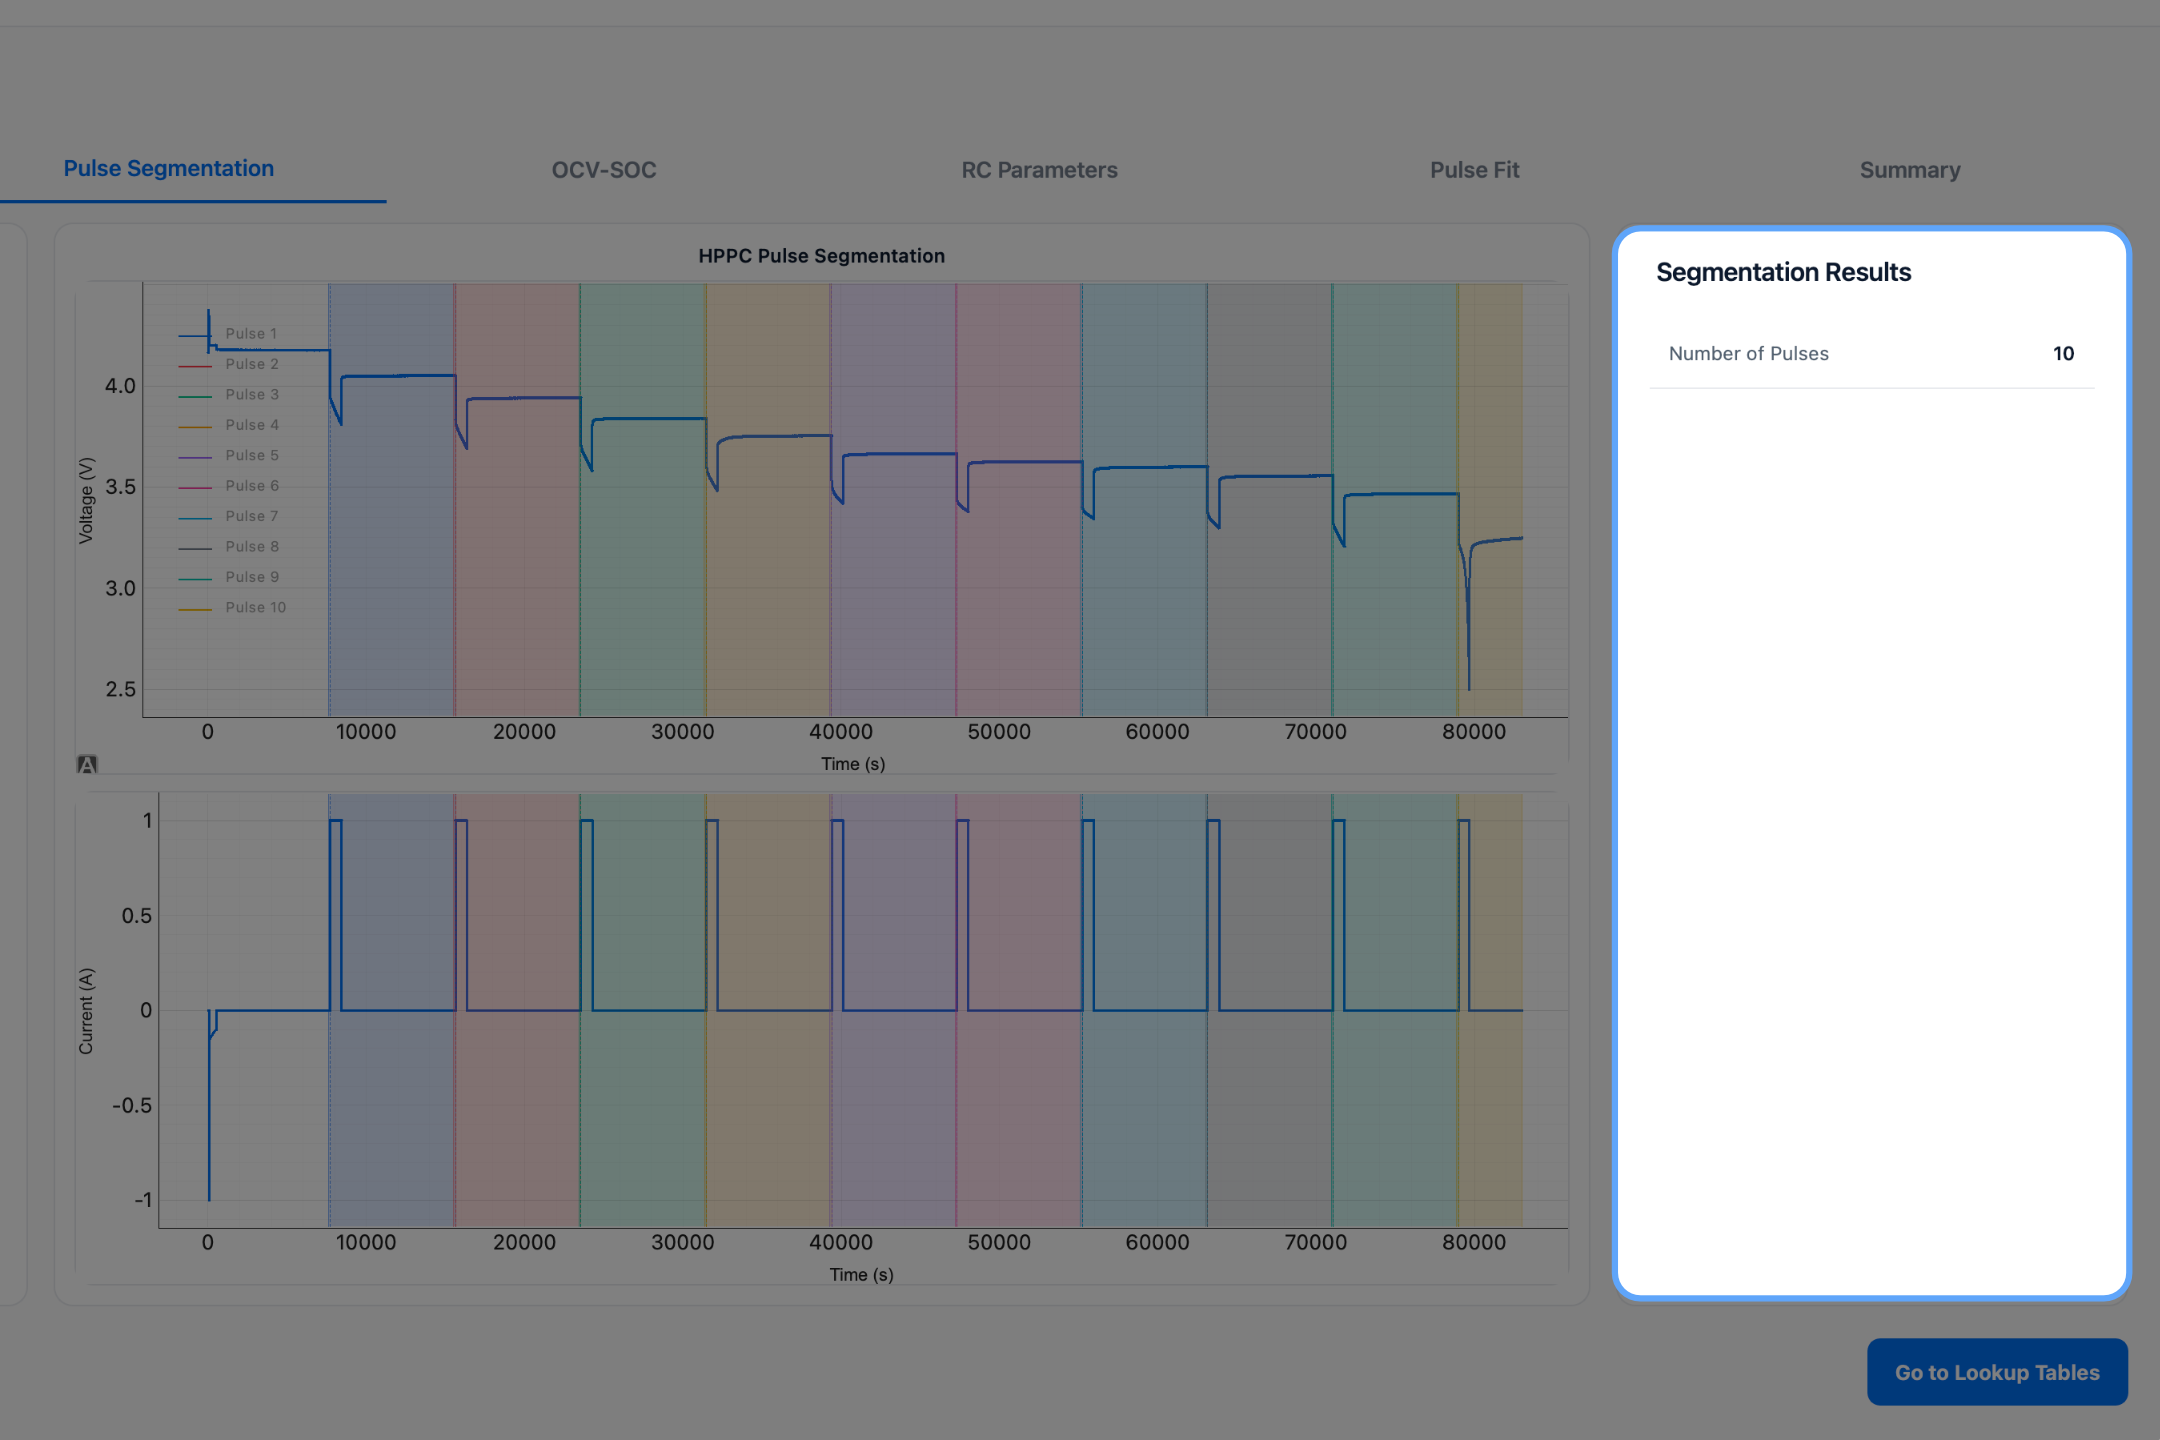
Segmentation Results
The right panel summarizes the segmentation process.
| Metric | Description |
|---|---|
| Number of Pulses | Total pulses detected in the selected dataset |
Users should verify that the detected pulse count matches the expected HPPC test structure before proceeding.
Expected Outcome
After reviewing this tab, the user should be able to:
- Confirm successful pulse detection.
- Verify pulse locations within the dataset.
- Validate the selected temperature and operating mode.
- Proceed to OCV-SOC characterization and ECM parameter extraction.